Inching Towards Digital
Download the full report as a PDF file: 
 Inching Towards Digital is released under a Creative Commons Attribution 4.0 International (CC BY 4.0) license.
Acknowledgements
The ongoing support from the William and Flora Hewlett Foundation makes these reports possible, and we are thankful for their continuing guidance. We’re also grateful to the Online Learning Consortium, who has served as administrator for our grant and provided invaluable feedback. The authors maintain full control over this report and how its findings are presented.
This project would not be possible without the faculty and administrators — over 3,000 respondents — who completed our survey. We review every response and read every submitted comment and have included some in this report with permission. Each quote is as close to the original as possible; modifications were made only to remove personally identifying information or correct obvious typos.
The project also received great support from the open education community, who offered feedback and advice throughout the course of this project.
This report would not have been possible without support from our colleagues. We thank Nate Ralph for his extensive copy editing and I. Elaine Allen for feedback throughout the process.
Finally, we also want to thank everyone who reads this report. Your comments and feedback help shape the future of this project and are always appreciated.
Julia E. Seaman
Jeff Seaman
Bay View Analytics
2026
Executive summary
This report surveys 3,635 U.S. higher-education faculty members regarding their course materials for the 2025-26 academic year. It examines textbook formats, digital versus print perspectives, curricula satisfaction, teaching modalities, and OER awareness and use.
This is the 15th report in our series of surveys tracking curricula discovery, selection, and adoption processes in U.S. higher education. The results have covered the rise of digital format options for course materials including the growth of OER, or open educational resources, and the dramatic shifts brought on by the COVID-19 pandemic. This year’s results elucidate the current post-pandemic status of course materials in higher education.
The survey responses for this analysis were collected in May and June 2026, from a total of 3,635 faculty.
The respondents come from all 50 U.S. states, the District of Columbia, Guam, and the Virgin Islands.
The key takeaways from this year’s survey are:
- Post-pandemic trends: Most year-over-year trends around digital course material adoption and sentiments have settled and remain consistent or only small changes for the last three years.
- Format options: The share of faculty offering their required textbook only in digital formats is slowly growing as the option for both formats declines; less than one in ten faculty use print-only versions.
- Curricula quality: Faculty give their curriculum overall passing grades (81%), with accuracy highest (88%) and cost to student (72%) and included materials (73%) just passing. While there were minimal grade differences by format, there were some differences by publisher type. OER materials had the highest overall grade (84%) compared to commercial publishers.
- OER awareness and adoption: Levels of OER awareness and adoption were similar to last year, growing only 3% and 1%, respectively. Nevertheless, the growth in awareness brings it closer to the peak level from 2022-23, and the growth in use brings it to its all time highest value in the research period.
Study results
Teaching modalities
Key finding
Most faculty stick to one teaching mode. Sixty-five percent of faculty taught one modality, unchanged from 2024-25. The majority teach a face-to-face course while slightly less than half teach a fully online course. The proportion of online to face-to-face courses has settled into a post-pandemic state as minimal changes over the last four years.
We asked what modalities faculty used to teach in for at least one course in the Spring 2026 term.
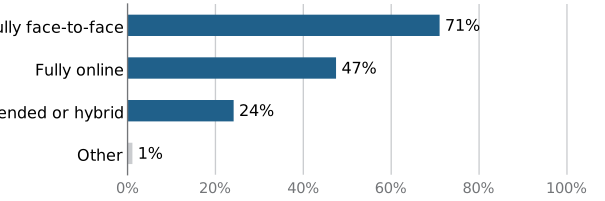
Figure 1. n = 3,631. Data: table for figure 1.
Faculty reported which teaching modalities they used for their courses. The majority of faculty (71%) taught fully face-to-face. Almost half of all faculty (47%) taught at least one course fully online, where there was no in-person or on-campus instruction. A smaller group of faculty, just under a quarter (24%), taught a blended or hybrid course, which mixes both online and in-person instruction.
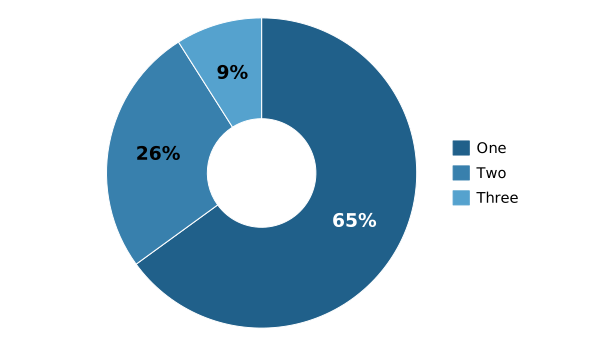
Figure 2. n = 3,631. Data: table for figure 2.
Faculty generally teach more than one course in a term, and it is possible that they have courses that use different formats.
Figure 2 shows how many different teaching modalities faculty reported using. The majority of faculty (65%) taught one modality, 26% two of the modalities and 9% taught all three modalities. Compared with 2024-25, one was unchanged at 65%, two fell 1% from 27% and three rose 1% from 8%.
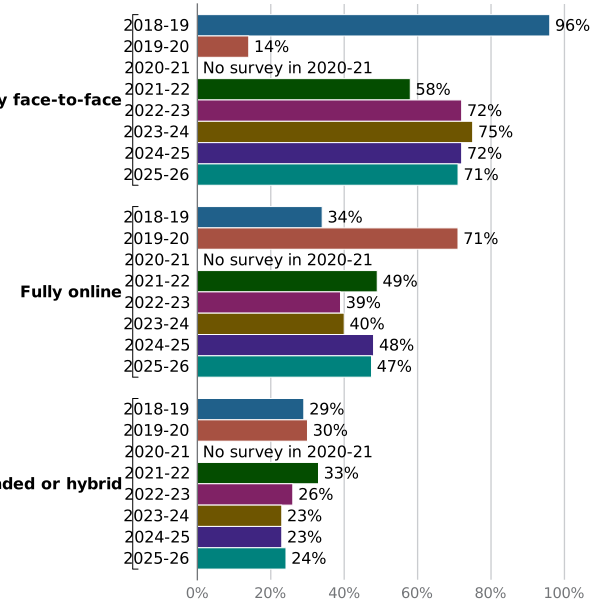
Figure 3. n = 3,631. Data: table for figure 3.
This series follows course formats over seven surveys, from 2018-19 to 2025-26; there was no survey in 2020-21 due to the COVID-19 pandemic. In 2025-26, fully face-to-face was the most common, at 71%, followed by fully online (47%) and blended or hybrid (24%). Across the years shown, fully face-to-face varied the most and blended or hybrid the least.
In 2025-26, 71% of faculty taught fully face-to-face, almost the same as the three prior years (72% to 75%). Face-to-face has the largest pandemic-related changes. Pre-pandemic courses were almost universally in-person, reflected by 96% of faculty stating they taught face-to-face. However, in 2019-20 it dropped to 14%, with a climb back to 58% in 2021-22.
In 2025-26, nearly half of faculty (47%) taught fully online, similar to 2024-25. While less drastic than the pandemic changes for face-to-face courses, fully online courses showed the complementary pattern of low pre-pandemic (34%), large increase during the pandemic (71%), followed by a post-pandemic fall to 39% to 49%.
Blended courses show minimal changes even through the pandemic and are the least common format for all but the 2019-20 pandemic year. Across the years shown, it ranged from 23% in 2023-24 and 2024-25 to 33% in 2021-22.
Textbook formats
Key finding
Textbook use continues a shift toward digital options. Thirty-three percent of faculty offered the required textbook in digital-only format in 2025-26, up 4% from 29% in 2024-25, the highest of the years shown.
I would love for all my students to have access to the digital tools AND the paper book, as most students still prefer a physical book.”
Full-time Natural Sciences Faculty
The paper book cost was over $300. The online cost was about $60. Many of my students really seem to benefit from paper copies, but this text is simply impossible to recommend at $300. The content is just what I want, though, so I still force them to acquire it.”
Full-time Natural Sciences Faculty
I just want books to be more affordable to students.”
Full-time Education Faculty
Most of the students used e-texts and will not have access to the material or information in a year, yet it costs almost as much as a real textbook.”
Full-time Engineering Faculty
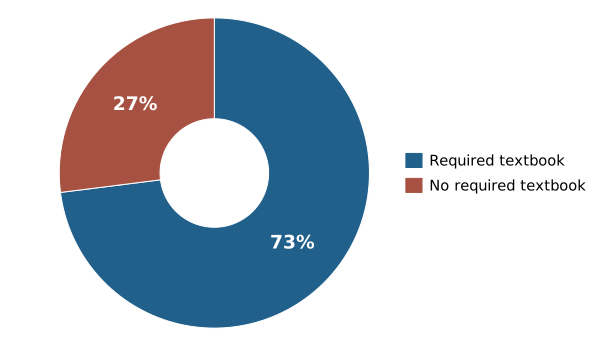
Figure 4. n = 3,624. Data: table for figure 4.
Faculty were asked whether they required a textbook. The majority of faculty (73%) required a textbook, while 27% did not, down 2% from 75% in 2024-25.
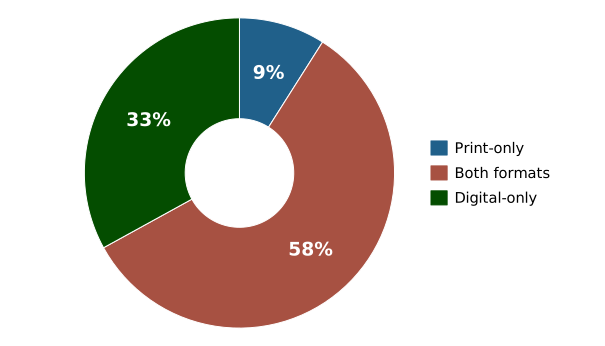
Figure 5. n = 2,664. Data: table for figure 5.
Faculty also reported the formats in which the required textbook was made available to students. The majority of faculty (58%) offered the required textbook in both formats, 33% in digital only and 9% in print only. Compared with 2024-25, both formats fell 3% from 61%, digital-only rose 4% from 29% and print-only fell 1% from 10%.
However, it is important to note that while faculty often choose the specific textbook, they may have less direct control over the formats available. Publishers often provide the textbooks to the institutional bookstores and students directly in both formats. Additionally, the faculty are reporting how the textbook was officially offered, not necessarily the formats students preferred, used, purchased, or found.
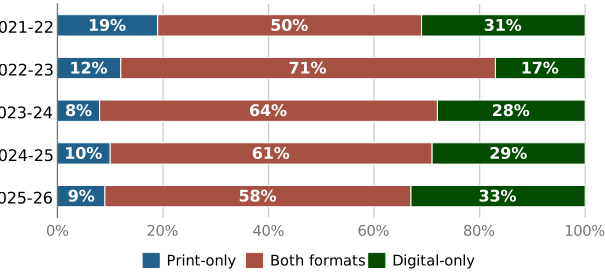
Figure 6. n = 2,664. Data: table for figure 6.
Figure 6 follows the required textbook format by year from 2021-22 to 2025-26. Across the years shown, both formats varied the most, from 50% to 71%, and print-only the least, from 8% to 19%.
Across the years, faculty offering their required textbooks in both formats has been the most common option, followed by digital-only and then print-only. While the order has remained the same, the overall proportion of print-only textbooks has shrunk. This represents a clear shift away from print over the last half decade. Nevertheless, there remains a small but steady group of faculty who use print-only textbook versions.
Perspectives on digital versus print
Key finding
Faculty find benefits for both print and digital materials. A majority believe digital offers greater flexibility for students, and just under half believe print materials are better for student learning.
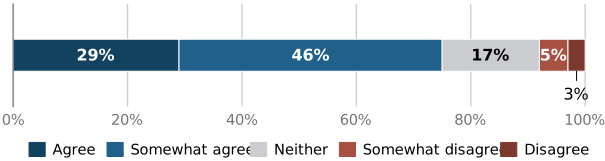
Figure 7. n = 3,348. Data: table for figure 7.
Digital materials get clear credit for flexibility. Three-quarters of faculty (75%) agreed or somewhat agreed that digital materials provide greater flexibility for students (29% agree, 46% somewhat agree). Seventeen percent neither agreed nor disagreed. On the negative side, 8% disagreed or somewhat disagreed (5% somewhat disagree, 3% disagree).
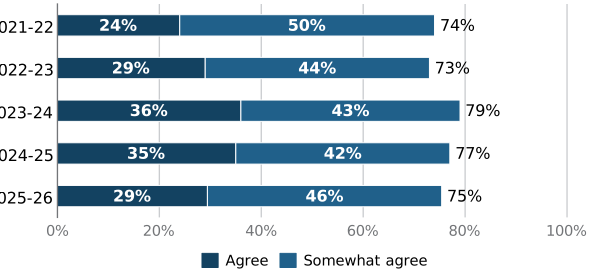
Figure 8. n = 3,348. Data: table for figure 8.
Agreement that digital materials provide greater flexibility for students has been measured over the last five years, from 2021-22 to 2025-26. Combined agreement has remained stable over this period, with a range of only 6% difference. However, the depth of agreement varied a bit as faculty agreement initially increased from “somewhat agree” to “agree” and then had a small 6% drop this past year.
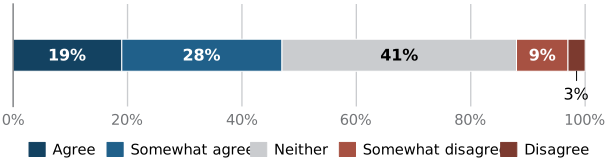
Figure 9. n = 3,348. Data: table for figure 9.
Faculty views on learning from print are more divided. Nearly half of faculty (47%) agreed or somewhat agreed that students learn better from print materials than they do from digital materials (19% agree, 28% somewhat agree). Forty-one percent neither agreed nor disagreed, and 12% disagreed or somewhat disagreed (9% somewhat disagree, 3% disagree).
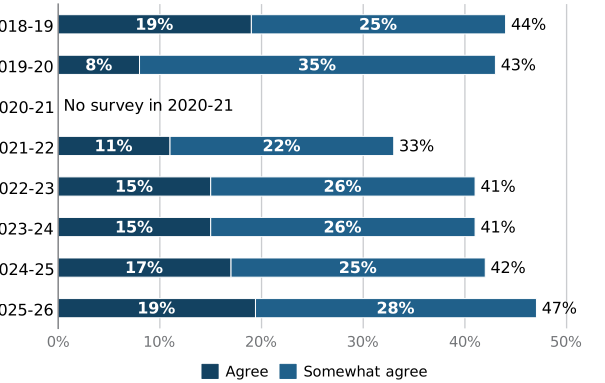
Figure 10. n = 3,348. Data: table for figure 10.
Since 2018-19, faculty have been asked whether students learn better from print materials than from digital materials. Combined agreement was 47% in 2025-26, up 5% from 42% in 2024-25, which is the highest level measured. Across the years shown, combined agreement ranged from 33% in 2021-22 to 47% in 2025-26. The share who agreed has been steadily rising since 2019-20, from a low of 8% to the current high level of 19%.
In open-ended comments, faculty respondents expressed mixed views on the utility and accessibility of online course materials. Several respondents noted significant friction in using digital platforms, citing software that is difficult for students to navigate or technical issues that hinder access. Others found the online components insufficient for their teaching needs, with one instructor reporting a lack of readily available test banks that forced them to manually reformat exams, while another felt the provided web resources were merely redundant to their lectures.
Quality control was also a concern, as some identified incorrect problems within the online homework libraries or noted that the digital version did not align well with the printed text. Conversely, a few respondents appreciated the cost savings and problem sets, though they still faced challenges like students sharing answer keys or finding the homework too easy without accompanying reading. Overall, while some valued the digital tools, several struggled with usability, content accuracy, or the lack of robust instructor support.
Curricula satisfaction
Key finding
Faculty generally rate curricula highly though grades vary by curricula attribute or publisher, but not much by format.
I don’t really want some students using paid access and some not - because that creates a headache in keeping track of what was done and what was left undone… Instead I try to figure out ways to “fake it” - ways to offer something similar at no cost to the students.”
Part-time Linguistics and Language Faculty
There just aren’t a lot of texts for the course. I tried open source, but there wasn’t anything at all available… So I ended up using the same old text, and it’s basically old enough to drive at this point. I really want something newer and less expensive for the students; there just doesn’t seem to be anything else available.”
Part-time Social Sciences Faculty
Faculty reported on their satisfaction with course materials for the 2025-26 academic year for their largest enrollment class across multiple metrics, using a 0-100 scale, analyzed both as the average rating and converted to grade scales (A: 90-100%, B: 80-89%, C: 70-79%, D: 60-69%, F: less than 60%). Two metrics (accuracy and scope) specifically related to the content of the curricula. A third metric asked about the supplemental instructor materials included in many textbook packages, while the fourth asked faculty to rate their satisfaction with the cost to students for the curricula. Finally, faculty provided an overall rating for the curricula.

Figure 11. n = 3,252. Data: table for figure 11.
The chart shows how faculty rated their curricula. The average rating for curricula was 81%, similar to 2024-25 (80%).
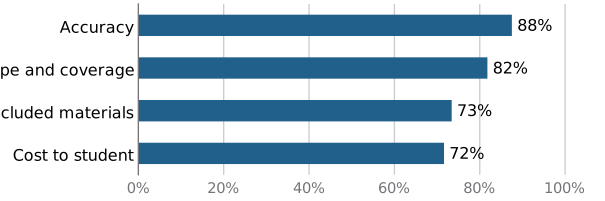
Figure 12. n = 3,251 (Accuracy), 3,275 (Scope and coverage), 2,097 (Included materials), 2,997 (Cost to student). Data: table for figure 12.
Faculty also rated their curricula on several key metrics. Faculty rated accuracy highest, at 88%, followed by scope and coverage (82%) and included materials (73%); cost to student rated lowest, at 72%. Accuracy clearly leads the other metrics in this group. Compared with 2024-25, accuracy rose 2% from 86%, scope and coverage rose 2% from 80%, included materials was unchanged at 73% and cost to student rose 1% from 71%.
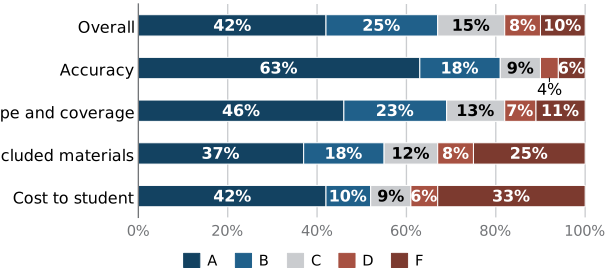
Figure 13. n = 3,252 (Overall), 3,251 (Accuracy), 3,275 (Scope and coverage), 2,097 (Included materials), 2,997 (Cost to student). Data: table for figure 13.
The grades behind those ratings show where faculty were most divided. Accuracy received the most A grades, at 63%, and included materials the fewest (37%). Cost to student received the most F grades, at 33%, and accuracy the fewest (6%). Cost to student drew the most divided grades: 42% gave it an A and 33% an F.
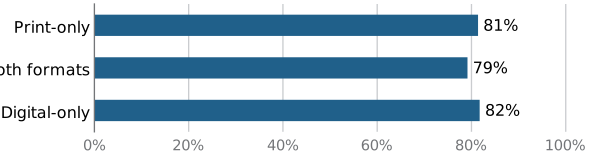
Figure 14. n = 233 (Print-only), 1,485 (Both formats), 841 (Digital-only). Data: table for figure 14.
Figure 14 compares ratings by the format of the materials used. Faculty rated all of the formats roughly equal, though digital-only was highest, at 82%, followed by print-only (81%); both formats rated lowest, at 79%.
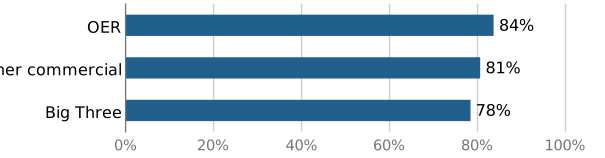
Figure 15. n = 308 (OER), 1,291 (Other commercial), 945 (Big Three). Data: table for figure 15.
Ratings also differed by publisher group: open educational resources (OER), “Big Three” (Cengage, McGraw Hill, and Pearson, named as they combined encompass the majority of the textbook market), or other commercial publishers. Faculty rated OER highest, at 84%, up 5% from 79% in 2024-25, followed by Other commercial (81%, up 1% from 80%); Big Three rated lowest, at 78%, unchanged from 2024-25.
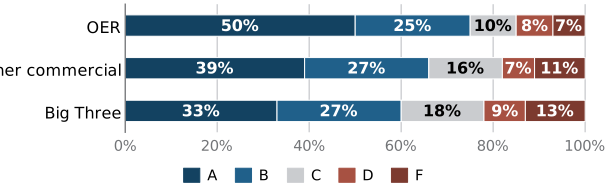
Figure 16. n = 308 (OER), 1,291 (Other commercial), 945 (Big Three). Data: table for figure 16.
The chart shows the distribution of how faculty graded curricula overall by publisher group. OER received the most A grades, at 50%, and Big Three the fewest (33%). Big Three received the most F grades, at 13%, and OER the fewest (7%).
In open-ended comments on their curricula ratings, faculty respondents expressed mixed satisfaction with their course materials, balancing content quality against cost and accessibility. Most respondents praised the accuracy and relevance of their chosen texts, noting that they covered necessary topics effectively. However, several highlighted significant drawbacks, such as high prices, outdated information, or a lack of comprehensive coverage that forced them to supplement with external sources.
A distinct subset of instructors emphasized the use of Open Educational Resources (OER) or self-created materials to eliminate student costs, valuing the flexibility to customize content despite the extra labor required. While some appreciated the free access and ease of use, others found OER lacking in ancillary support or interactive features compared to traditional textbooks. Ultimately, their views ranged from high satisfaction with specific, well-organized texts to frustration with the need to constantly assemble and update materials to meet course objectives.
OER awareness
Key finding
Faculty awareness of OER keeps growing, slow and steady: Sixty-two percent of faculty were aware of OER at some level in 2025-26, up 3% from 59% in 2024-25.
A lot of other OER platforms are mostly a replacement for a textbook or a chapter or an experiment, but they don’t provide the full experience. Publishers still have the overall advantage because when they present the textbook and homework platform and whatever else, the instructor can see how the course will work as a whole, whereas OER content requires faculty to piecemeal assemble their vision, and not everyone enjoys that process.”
Full-time Natural Sciences Faculty
Various of the readings may be OER. Frankly, though, I think a lot of teachers don’t pay much attention to whether materials are copyright, public domain or OER. We just freely use them, even while pontificating about intellectual property. Go figure!”
Part-time History and Government Faculty
Open educational resources (OER) are typically available in a digital format, either free or at very low cost. Unlike commercially published materials, OER materials are available under an open license, most often a Creative Commons license, which allows users to revise and redistribute them. Many OER materials are created and shared by educators and peers, although there are also OER publishers.
Measuring the awareness and use of OER materials isn’t straightforward. Many educators will adopt materials without fully understanding the licensing details, often misunderstanding what makes OER unique. Also, some may think “open” and “free” mean the same, assuming all free resources are OER.
To gauge awareness of OER, reports in this series have used a consistent question, which has proven to have the best balance in differentiating among the varying levels of awareness without confusing those with no prior knowledge of the concept. The specific wording has remained consistent to enable comparisons across years with earlier surveys. Additionally, the measure of OER awareness combines responses to Creative Commons licensing and OER awareness questions to ensure high-quality results.
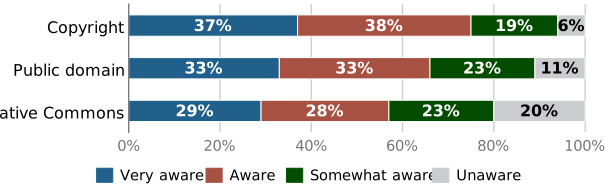
Figure 17. n = 3,327 (Copyright), 3,326 (Public domain), 3,316 (Creative Commons). Data: table for figure 17.
Faculty were asked how familiar they are with different types of licensing. Awareness at any level was highest for copyright (94%), followed by public domain (89%) and Creative Commons (80%). Copyright also had the largest share who were very aware, at 37%. Copyright clearly leads the other options in both overall recognition and deep understanding.
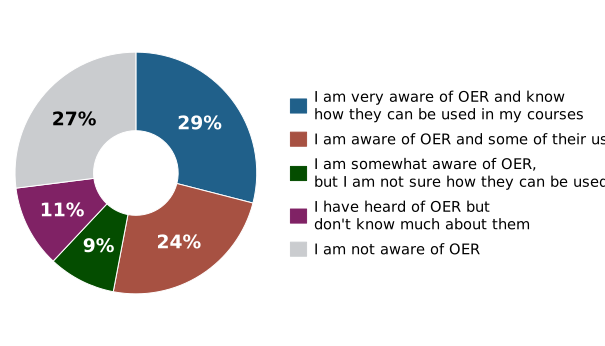
Figure 18. n = 3,324. Data: table for figure 18.
Faculty described their familiarity with open educational resources using one of five answers. The majority of faculty (62%) were aware of OER at some level: 29% very aware, 24% aware and 9% somewhat aware. A further 11% had heard of OER but knew little more about it, and 27% were not aware of OER.
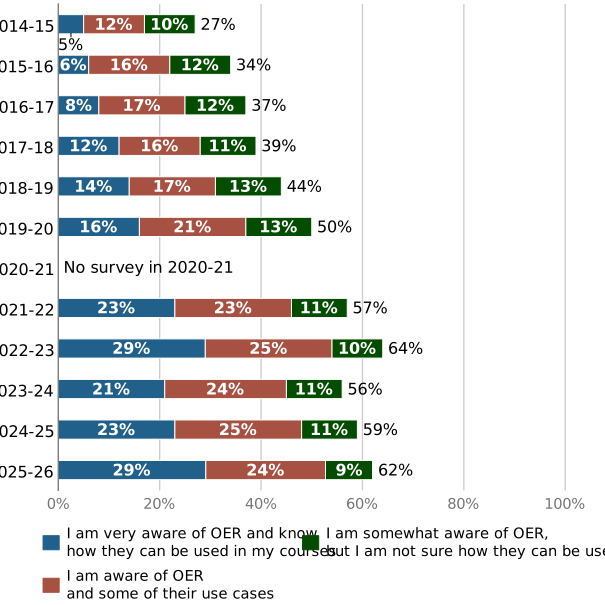
Figure 19. n = 3,324. Data: table for figure 19.
Awareness of OER at any level was 62% in 2025-26, up 3% from 59% in 2024-25. There was year over year growth in awareness starting from 27% in 2014-15 to 64% in 2022-23, until a short fall in 2023-24. The last two years have shown a steady increase, bringing overall awareness just 2% below its peak level. The depth of awareness has grown as overall awareness grows, from 5% very aware in 2014-15 to 29% in 2022-23. After a short decline, the share of those very aware is back up to 29% this year.
OER use
Key finding
Just over one-third of faculty aware of OER use it as a required material in a course, the highest level recorded.
I spend triple the time on my classes when I use OER. It’s like self punishment to do it, but I teach at a school where most students are low income so I use OER anyway. The other instructors in my department refuse to use OER.”
Full-time Computer and Information Science Faculty
I think OER is incredibly positive for everyone. It took about 7 years for me to find OER materials that met my standards, but once I did, I’ve jumped in wholeheartedly and I am now an editor for three OER books. The barriers I encountered initially were related to content and presentation: was the content clean and clear? did it flow? Was it actually level appropriate? Was it intuitively navigable? Was the material engaging? Was it ADA accessible?”
Full-time Linguistics and Language Faculty
I use OER texts in many of my courses. I assign chapters to read. I feel supported by my institution. If anything, I feel unsupported when I ask students to buy a book! My co-workers and admin look at me like I’m evil for asking students to purchase a $100 book. OER is supported. I wish buying textbooks was supported too! Sometimes the quality of the OER books is low so you need to use a good product!”
Full-time Philosophy Faculty
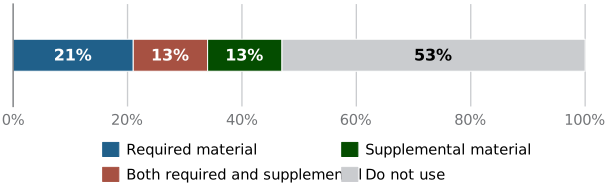
Figure 20. n = 2,356. Data: table for figure 20.
OER can be used in a course in several ways. These uses can include any type of classroom material, such as textbooks, homework, interactive activities, and more. These responses are by individual faculty, not by course: for this question, faculty can teach multiple courses and use OER in only one, or across all of them.
For faculty who were aware of OER, just over half (53%) answered that they “do not use” it; the other 47% were divided between using as required material (21%), both required and supplemental material (13%), and just supplemental material (13%). Compared with 2024-25, “do not use” rose 2% from 51%, required material rose 3% from 18%, both required and supplemental material fell 2% from 15% and supplemental material fell 3% from 16%.
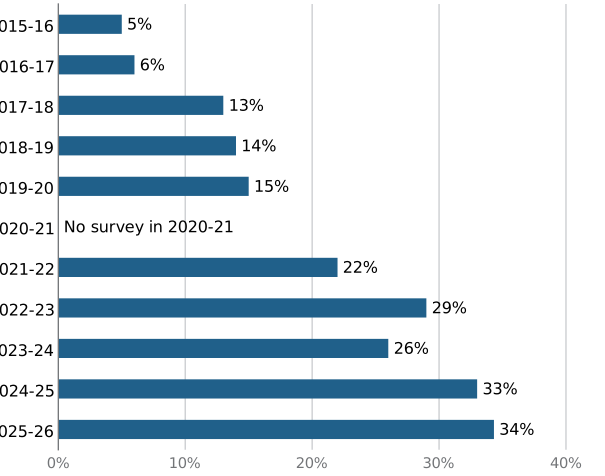
Figure 21. n = 2,356. Data: table for figure 21.
Required use of OER has been tracked for ten years, from 2015-16 to 2025-26. In 2025-26, one-third of faculty aware of OER (34%) used required OER, up 1% from 33% in 2024-25. Across the years shown, it started from 5% in 2015-16 and bounced a bit up to the current 34% in 2025-26, the highest level measured.
Faculty views on OER adoption are mixed, with many citing student cost savings as a primary motivation. While several respondents report no institutional barriers and describe OER as high-quality or equivalent to commercial texts, others express significant dissatisfaction. A recurring concern is the lack of accompanying digital tools, such as autograded homework systems, which complicates course management. Additionally, some faculty find the search process time-consuming and the available materials inconsistent in quality or depth. While a few instructors have successfully created their own OER or use them exclusively, others remain skeptical, preferring traditional publisher resources for their reliability and integrated features.
Summary
Faculty teaching patterns remain stable, with most instructors sticking to a single delivery method. Sixty-five percent of faculty taught one modality, unchanged from 2024-25. Seventy-one percent of faculty taught fully face-to-face in 2025-26, almost identical proportions to the three prior years.
Textbook requirements are slightly less common, and dual-format offerings are slowly declining in favor of digital-only. Seventy-three percent of faculty required a textbook, down 2% from 75% in 2024-25 and 4% from 2023-24.
Perceptions of learning tools show a tension between flexibility and traditional preferences. Seventy-five percent of faculty agreed or somewhat agreed that digital materials provide greater flexibility for students in 2025-26, down 2% from 77% in 2024-25, while 47% of faculty agreed or somewhat agreed that students learn better from print materials than they do from digital materials in 2025-26, up 5% from 42% in 2024-25.
Curricula quality is viewed positively, with accuracy being the strongest metric. The average rating for curricula was 81%, up 1% from 80% in 2024-25. Faculty rated quality similar across formats while giving higher scores to OER over commercial publishers.
Open Educational Resources are gaining ground in both awareness and adoption. Sixty-two percent of faculty were aware of OER at some level in 2025-26, up 3% from 59% in 2024-25. Thirty-four percent of faculty aware of OER used required OER in 2025-26, up 1% from 33% in 2024-25, the highest recorded measurement.
Next steps
This series tracks how U.S. faculty select and use course materials, covering formats, digital versus print preferences, satisfaction, teaching modes, and open educational resources. We look at awareness and actual adoption of OER alongside traditional textbooks. These results show current practices but leave several questions open. We do not yet know how long-term curriculum changes affect material choices or how institutional policies shape individual decisions. The relationship between teaching modalities and specific format preferences remains unclear. We also lack insight into how faculty satisfaction with existing resources influences their willingness to switch to new types of materials. Understanding these dynamics requires further exploration beyond the current snapshot. The data highlight where practices stand but not why they persist or how they evolve over time. Future inquiry should focus on the underlying drivers of these choices and the barriers to adopting alternative resources.
Methodology
This survey was conducted in May and June 2026, with a total of 3,635 faculty responses. The respondents come from all 50 U.S. states, the District of Columbia, Guam, and the Virgin Islands. There was no survey in 2020-21; it was delayed by the COVID-19 pandemic.
The data for this report come from survey results using a national sample of teaching faculty. The sample is representative of the broad range of teaching faculty in U.S. higher education. The sample selection process was multi-stage. The process began by obtaining data from several commercial list sources that were then combined with a faculty panel assembled by Bay View Analytics. The first step selected all faculty who taught at least one course. Individuals were then randomly selected from the master list in proportion to the number contained in each Carnegie Classification, to produce a second-stage selection of teaching faculty and department chairpersons. The resulting lists were checked against opt-out lists, as well as for non-functioning email addresses.
The respondents represent the full range of higher education institutions (two-year, four-year, all Carnegie classifications, and public, private nonprofit, and for-profit) and the complete range of faculty (full- and part-time, tenured or not, and all disciplines). The data were weighted for accurate institutional classification and location representation. Respondents represent over 1,200 different institutions.
Institutional descriptive data come from the National Center for Education Statistics’ IPEDS database.1 After the data were compiled and merged with the IPEDS database, respondents and nonrespondents were compared to ensure that the survey results reflected the characteristics of the entire population of faculty. The responses were compared for 35 unique categories based on the current Carnegie Classification of Institutions of Higher Education.
As noted in our previous reports, the specific wording of questions is critical in measuring the level of OER awareness. The language for this report (provided below) matches that used in previous reports in this series. It was found to have the best balance in differentiating amongst different levels of awareness, while avoiding leading those with no prior knowledge of the concept.
How aware are you of Open Educational Resources (OER)? OER is defined as “teaching, learning, and research resources that reside in the public domain or have been released under an intellectual property license that permits their free use and re-purposing by others.” Unlike traditionally copyrighted material, these resources are available for “open” use, which means users can edit, modify, customize, and share them.
- I am not aware of OER
- I have heard of OER, but don’t know much about them
- I am somewhat aware of OER but I am not sure how they can be used
- I am aware of OER and some of their use cases
- I am very aware of OER and know how they can be used in the classroom
This question may still slightly overstate the level of OER awareness, so we also ask a series of additional questions. Because licensing for remixing and reuse is central to the concept of OER, a question about the respondent’s awareness of different legal permissions was asked of all respondents before any questions about OER awareness itself:
How aware are you of each of the following licensing mechanisms?
- Public domain
- Copyright
- Creative Commons
Answered as: unaware, somewhat aware, aware, or very aware.
By combining the responses from the OER awareness question with those of the licensing questions, a combined index of awareness is constructed. An identical process was used in previous reports in this series, to permit year-over-year comparisons and trend analysis.
Definitions
This study explores how faculty members select and use the educational materials used in their courses. The primary sample represents all teaching faculty across all types of degree-granting higher education institutions in the United States. The most common educational material employed in a course is the required textbook: faculty members typically choose one or more books that all students use throughout the course. Faculty also employ a wide range of other materials — some optional, others required for all students. This study focuses on the required materials, using the following definition:
Items listed in the course syllabus as required for all students, either acquired on their own or provided to all students through a materials fee; examples include printed or digital textbooks, other course-complete printed (course pack) or digital materials, or materials such as laboratory supplies.
In addition to examining the overall resource selection process, this study also explores the class of materials classified as Open Educational Resources (OER). The definition presented to the respondents in the study’s questionnaire comes from the William and Flora Hewlett Foundation:
OER are teaching, learning, and research resources that reside in the public domain or have been released under an intellectual property license that permits their free use and re-purposing by others. Open educational resources include full courses, course materials, modules, textbooks, streaming videos, tests, software, and any other tools, materials, or techniques used to support access to knowledge.
William and Flora Hewlett Foundation2
An essential aspect of examining the use of educational resources is the licensing status of such materials: who owns the rights to use and distribute the material, and does the faculty member have the right to modify, reuse, or redistribute said content? The legal mechanism that faculty are most familiar with is that of copyright. The U.S. Copyright Office defines copyright as:
A form of protection provided by the laws of the United States for “original works of authorship”, including literary, dramatic, musical, architectural, cartographic, choreographic, pantomimic, pictorial, graphic, sculptural, and audiovisual creations. “Copyright” literally means the right to copy but has come to mean that body of exclusive rights granted by law to copyright owners for protection of their work. … Copyright covers both published and unpublished works.
U.S. Copyright Office3
Not all material is copyrighted. Some content may be ineligible for copyright, copyrights may have expired, or authors may have dedicated their content to the public domain (e.g., using Creative Commons public domain dedication4).
Public domain is a designation for content that is not protected by any copyright law or other restriction and may be freely copied, shared, altered, and republished by anyone. The designation means, essentially, that the content belongs to the community at large.5
Materials can also be released under a Creative Commons license, which is not an alternative to copyright, but rather a modification of the traditional copyright license that grants some rights to the public.
The most common way to openly license copyrighted education materials — making them OER — is to add a Creative Commons (CC) license to the educational resource. CC licenses are standardized, free-to-use, open copyright licenses.6
Appendix: data tables
Figure 1. 2025-26 Faculty: Current teaching modality (select all)
| Modality | Percent |
|---|---|
| Fully face-to-face | 71% |
| Fully online | 47% |
| Blended or hybrid | 24% |
| Other | 1% |
Figure 2. 2025-26 Faculty: Number of modalities taught
| Answer | Percent |
|---|---|
| One | 65% |
| Two | 26% |
| Three | 9% |
Figure 3. Faculty: Teaching modality by year (select all)
| Year | Fully face-to-face | Fully online | Blended or hybrid |
|---|---|---|---|
| 2018-19 | 96% | 34% | 29% |
| 2019-20 | 14% | 71% | 30% |
| 2020-21 | No survey | No survey | No survey |
| 2021-22 | 58% | 49% | 33% |
| 2022-23 | 72% | 39% | 26% |
| 2023-24 | 75% | 40% | 23% |
| 2024-25 | 72% | 48% | 23% |
| 2025-26 | 71% | 47% | 24% |
Figure 4. 2025-26 Faculty: Textbook use
| Answer | Percent |
|---|---|
| Required textbook | 73% |
| No required textbook | 27% |
Figure 5. 2025-26 Faculty: Required textbook format
| Format | Percent |
|---|---|
| Print-only | 9% |
| Both formats | 58% |
| Digital-only | 33% |
Figure 6. Faculty: Required textbook format by year
| Year | Print-only | Both formats | Digital-only |
|---|---|---|---|
| 2021-22 | 19% | 50% | 31% |
| 2022-23 | 12% | 71% | 17% |
| 2023-24 | 8% | 64% | 28% |
| 2024-25 | 10% | 61% | 29% |
| 2025-26 | 9% | 58% | 33% |
Figure 7. 2025-26 Faculty: Agreement with “Digital materials provide greater flexibility for students.”
| Answer | Percent |
|---|---|
| Agree | 29% |
| Somewhat agree | 46% |
| Neither agree nor disagree | 17% |
| Somewhat disagree | 5% |
| Disagree | 3% |
Figure 8. Faculty: Agreement with “Digital materials provide greater flexibility for students” by year
| Year | Agree | Somewhat agree |
|---|---|---|
| 2021-22 | 24% | 50% |
| 2022-23 | 29% | 44% |
| 2023-24 | 36% | 43% |
| 2024-25 | 35% | 42% |
| 2025-26 | 29% | 46% |
Figure 9. 2025-26 Faculty: Agreement with “Students learn better from print materials than they do from digital materials.”
| Answer | Percent |
|---|---|
| Agree | 19% |
| Somewhat agree | 28% |
| Neither agree nor disagree | 41% |
| Somewhat disagree | 9% |
| Disagree | 3% |
Figure 10. Faculty: Agreement with “Students learn better from print materials than they do from digital materials” by year
| Year | Agree | Somewhat agree |
|---|---|---|
| 2018-19 | 19% | 25% |
| 2019-20 | 8% | 35% |
| 2020-21 | No survey | No survey |
| 2021-22 | 11% | 22% |
| 2022-23 | 15% | 26% |
| 2023-24 | 15% | 26% |
| 2024-25 | 17% | 25% |
| 2025-26 | 19% | 28% |
Figure 11. 2025-26 Faculty: Average rating for curricula
| Metric | Percent |
|---|---|
| Overall | 81% |
Figure 12. 2025-26 Faculty: Average rating for curricula metrics
| Metric | Percent |
|---|---|
| Accuracy | 88% |
| Scope and coverage | 82% |
| Included materials | 73% |
| Cost to student | 72% |
Figure 13. 2025-26 Faculty: Grade for curricula metrics
| Metric | A | B | C | D | F |
|---|---|---|---|---|---|
| Overall | 42% | 25% | 15% | 8% | 10% |
| Accuracy | 63% | 18% | 9% | 4% | 6% |
| Scope and coverage | 46% | 23% | 13% | 7% | 11% |
| Included materials | 37% | 18% | 12% | 8% | 25% |
| Cost to student | 42% | 10% | 9% | 6% | 33% |
Figure 14. 2025-26 Faculty: Average rating for curricula by format
| Format | Percent |
|---|---|
| Print-only | 81% |
| Both formats | 79% |
| Digital-only | 82% |
Figure 15. 2025-26 Faculty: Average rating for curricula by publisher group
| Publisher group | Percent |
|---|---|
| OER | 84% |
| Other commercial | 81% |
| Big Three | 78% |
Figure 16. 2025-26 Faculty: Grade for curricula overall by publisher group
| Publisher group | A | B | C | D | F |
|---|---|---|---|---|---|
| OER | 50% | 25% | 10% | 8% | 7% |
| Other commercial | 39% | 27% | 16% | 7% | 11% |
| Big Three | 33% | 27% | 18% | 9% | 13% |
Figure 17. 2025-26 Faculty: Licensing awareness
| Licensing mechanism | Very aware | Aware | Somewhat aware | Unaware |
|---|---|---|---|---|
| Copyright | 37% | 38% | 19% | 6% |
| Public domain | 33% | 33% | 23% | 11% |
| Creative Commons | 29% | 28% | 23% | 20% |
Figure 18. 2025-26 Faculty: OER awareness
| Answer | Percent |
|---|---|
| I am very aware of OER and know how they can be used in my courses | 29% |
| I am aware of OER and some of their use cases | 24% |
| I am somewhat aware of OER, but I am not sure how they can be used | 9% |
| I have heard of OER but don’t know much about them | 11% |
| I am not aware of OER | 27% |
Figure 19. Faculty: OER awareness by year
| Year | I am very aware of OER and know how they can be used in my courses | I am aware of OER and some of their use cases | I am somewhat aware of OER, but I am not sure how they can be used |
|---|---|---|---|
| 2014-15 | 5% | 12% | 10% |
| 2015-16 | 6% | 16% | 12% |
| 2016-17 | 8% | 17% | 12% |
| 2017-18 | 12% | 16% | 11% |
| 2018-19 | 14% | 17% | 13% |
| 2019-20 | 16% | 21% | 13% |
| 2020-21 | No survey | No survey | No survey |
| 2021-22 | 23% | 23% | 11% |
| 2022-23 | 29% | 25% | 10% |
| 2023-24 | 21% | 24% | 11% |
| 2024-25 | 23% | 25% | 11% |
| 2025-26 | 29% | 24% | 9% |
Figure 20. 2025-26 Faculty: OER use
| Answer | Percent |
|---|---|
| Required material | 21% |
| Both required and supplemental | 13% |
| Supplemental material | 13% |
| Do not use | 53% |
Figure 21. Faculty: Use of required OER by year
| Year | Percent |
|---|---|
| 2015-16 | 5% |
| 2016-17 | 6% |
| 2017-18 | 13% |
| 2018-19 | 14% |
| 2019-20 | 15% |
| 2020-21 | No survey |
| 2021-22 | 22% |
| 2022-23 | 29% |
| 2023-24 | 26% |
| 2024-25 | 33% |
| 2025-26 | 34% |
- http://nces.ed.gov/ipeds/datacenter/↑
- http://www.hewlett.org/programs/education-program/open-educational-resources↑
- http://www.copyright.gov/help/faq/definitions.html↑
- https://creativecommons.org/publicdomain/zero/1.0/↑
- http://whatis.techtarget.com/definition/public-domain↑
- State of the Commons report: https://stateof.creativecommons.org↑
Recent Publications
Course Material Affordability
- 2025 Virginia Course Materials Survey: Executive Summary (pdf)
- 2025 Virginia Course Materials Survey: Results & Findings (pdf)
- 2023 National Course Materials Survey (pdf)
- Pennsylvania Course Materials Survey 2023 (pdf)
Open Educational Resources
- Deeply Digital: Educational Resources in U.S. Higher Education, 2025 (pdf)
- Mixed Marks for Classroom Resources Educational Resources in U.S. K-12 Education, 2025 (pdf)
- Research Brief: Digital and OER Textbook Adoption
- Research Brief: Faculty Satisfaction with Course Materials varies by Publisher
Digital Learning Pulse Surveys
- Infographic: 2023-2024 Digital Learning Pulse Survey (pdf)
- The Digital Transformation of the Community College (pdf)
- Planning for a Smaller Future: Dealing with Declining Enrollments (pdf)
STEM
- Teaching Online: STEM Education in the Time of COVID (pdf)
- What Makes a STEM Student
- Perceptions of the Future of STEM Education
Distance Education
- Digital Faculty: Faculty Social Media Use and Communications (pdf)
- Infographic: Digital Faculty (pdf)
- Grade Increase: Tracking Distance Education in the United States (pdf)
Follow us on
 Twitter and
 LinkedIn.
Privacy
All survey respondents are provided complete anonymity. No personally identifiable information is released. Full privacy policy.