Research Article:
Digital curricula acceptance and use in Higher Education varies by region
Julia E. SeamanJeff Seaman
Nate Ralph
Faculty based at institutions in the Western US states are more likely to use digital materials, including OER materials.
After a global pandemic that saw a hurried transition to remote learning, our 2021-22 Higher Education Survey found that students returned to the classroom, with 58% of faculty stating they taught at least one face-to-face course in the 2021-22 school year. In addition, faculty and administrators expressed growing acceptance of digital courseware this year compared to earlier surveys, with 74% of both faculty and administrators saying that digital materials provide students with greater flexibility.
How do results vary by region?
The surveyed institutions were split into five¬ groups, by region, as shown in the map below. Survey results from the state of California were analyzed separately from the rest of the western region, because of the large number of respondents from the state.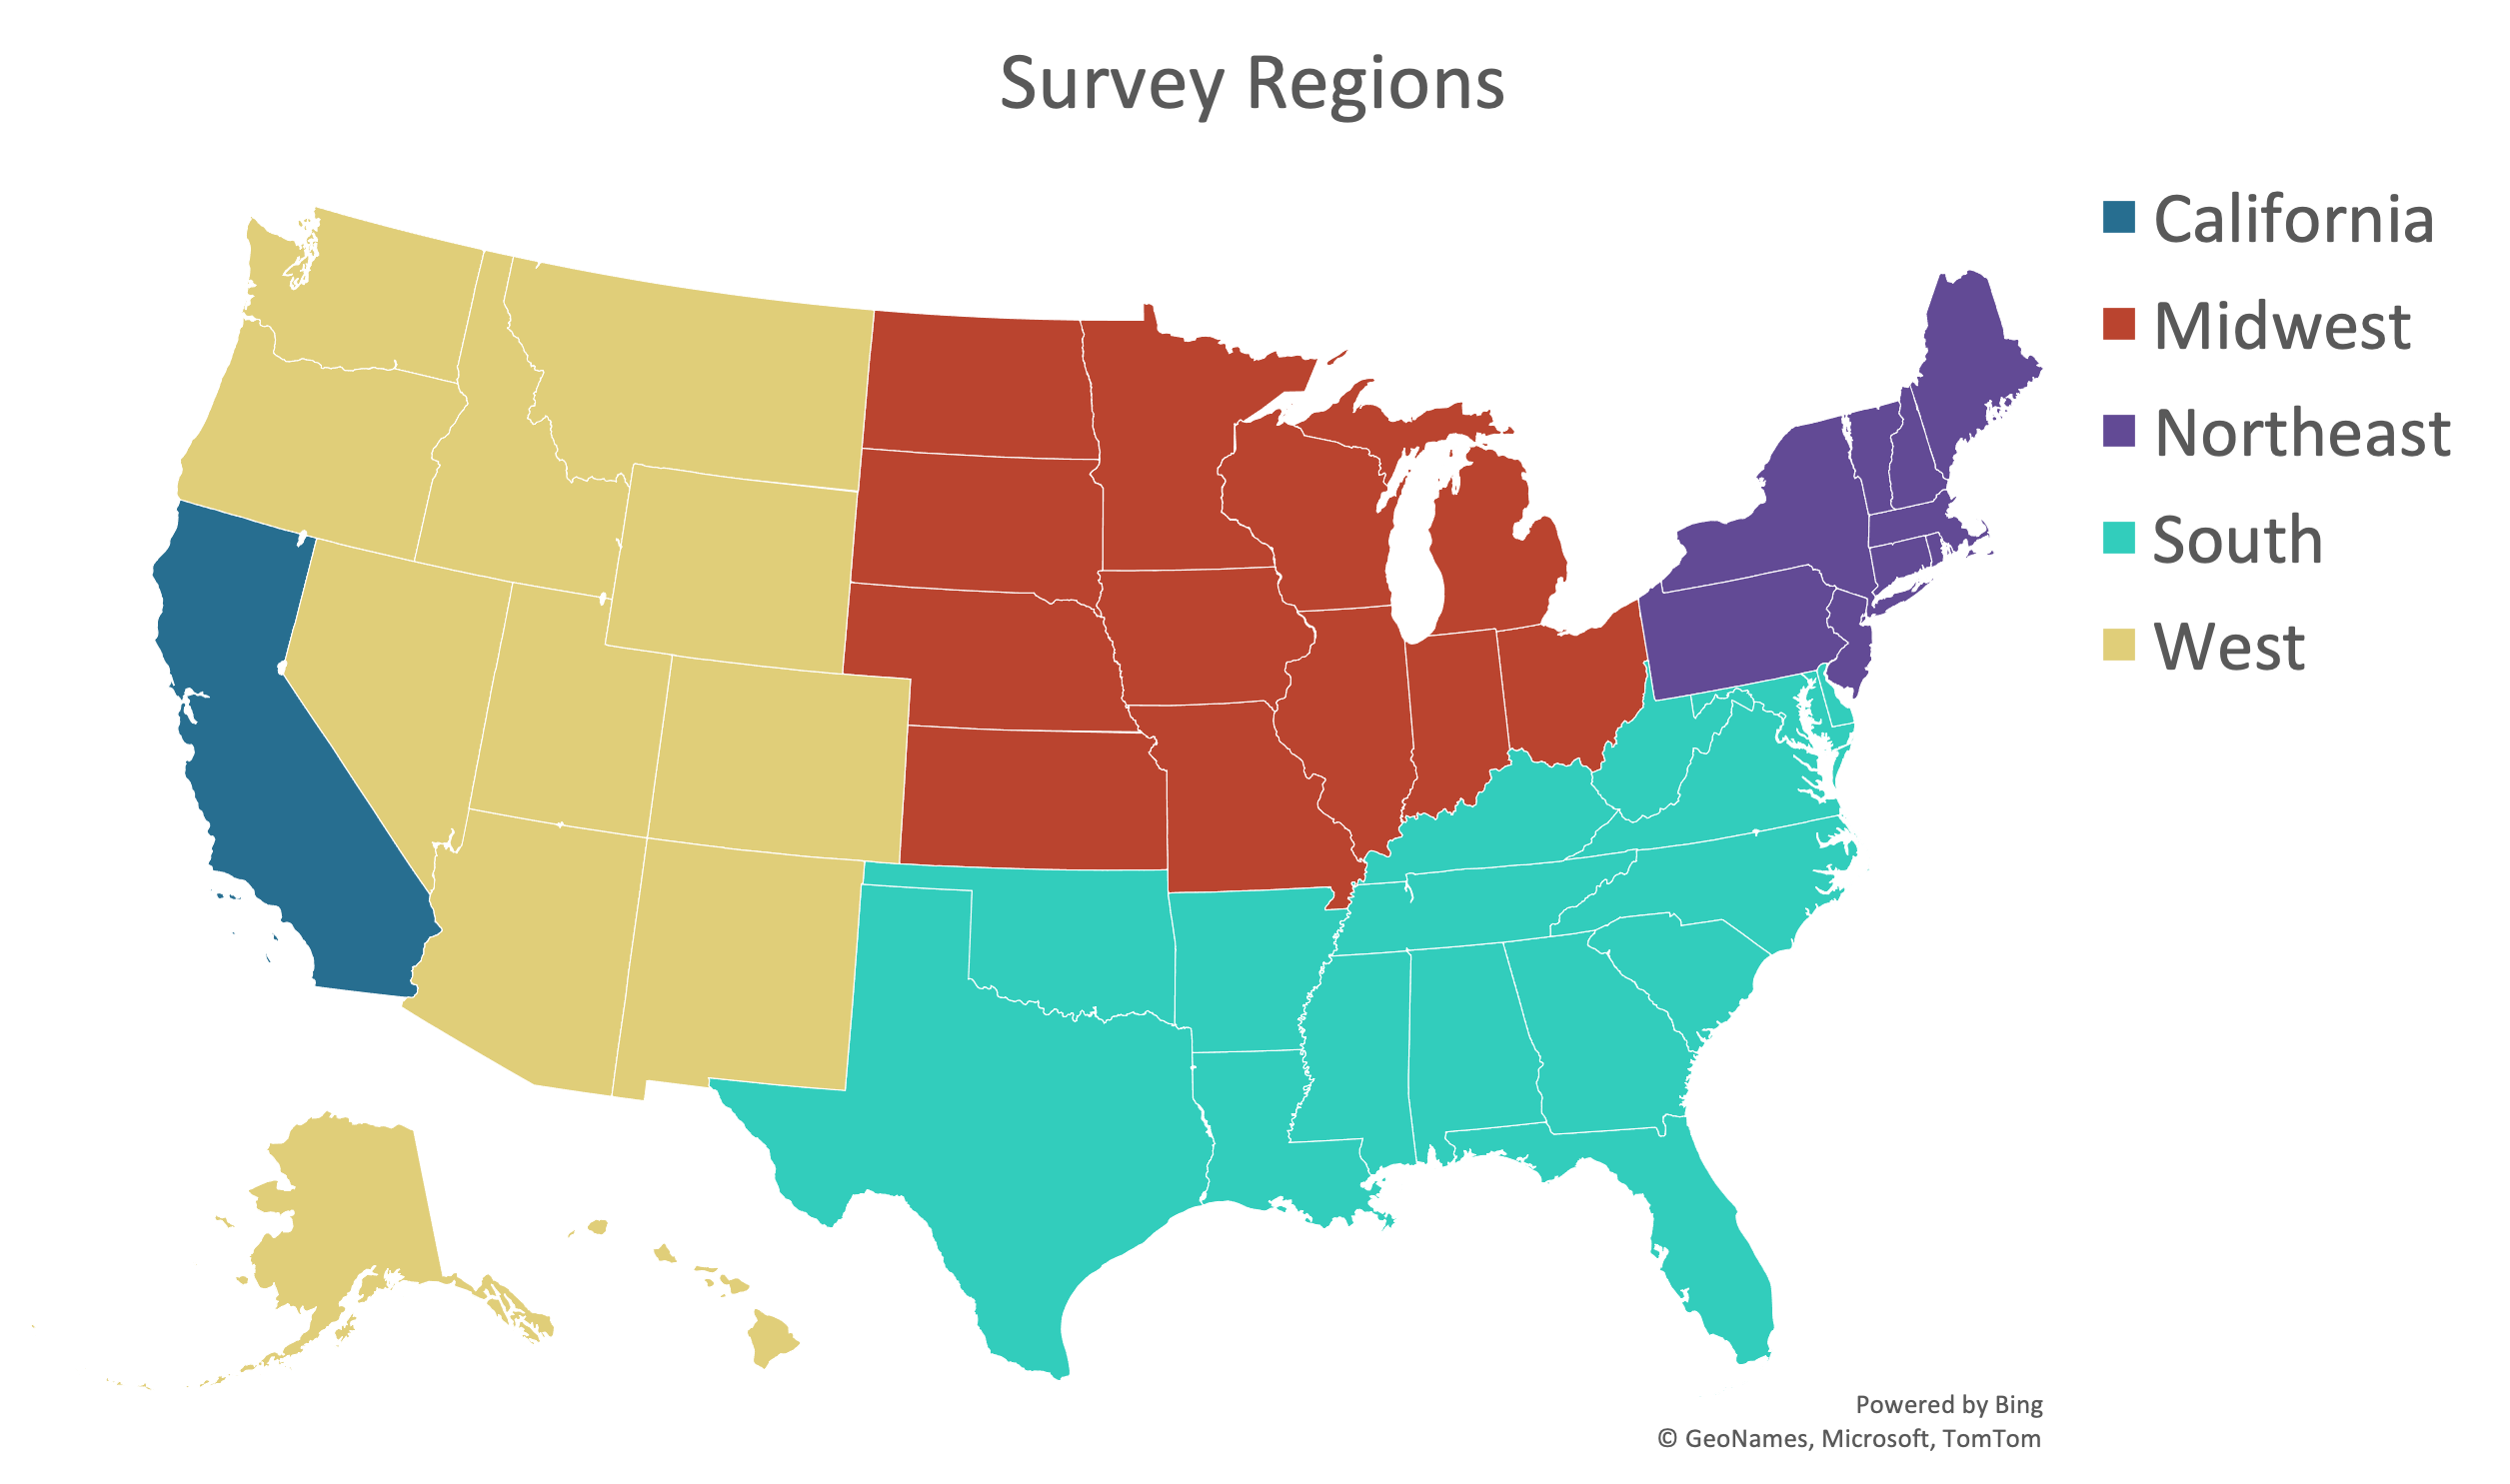
Teaching Modality
“The pandemic forced faculty to engage (sometimes unwillingly) with digital course materials and online learning. What could have taken many years occurred in a very short time frame.”
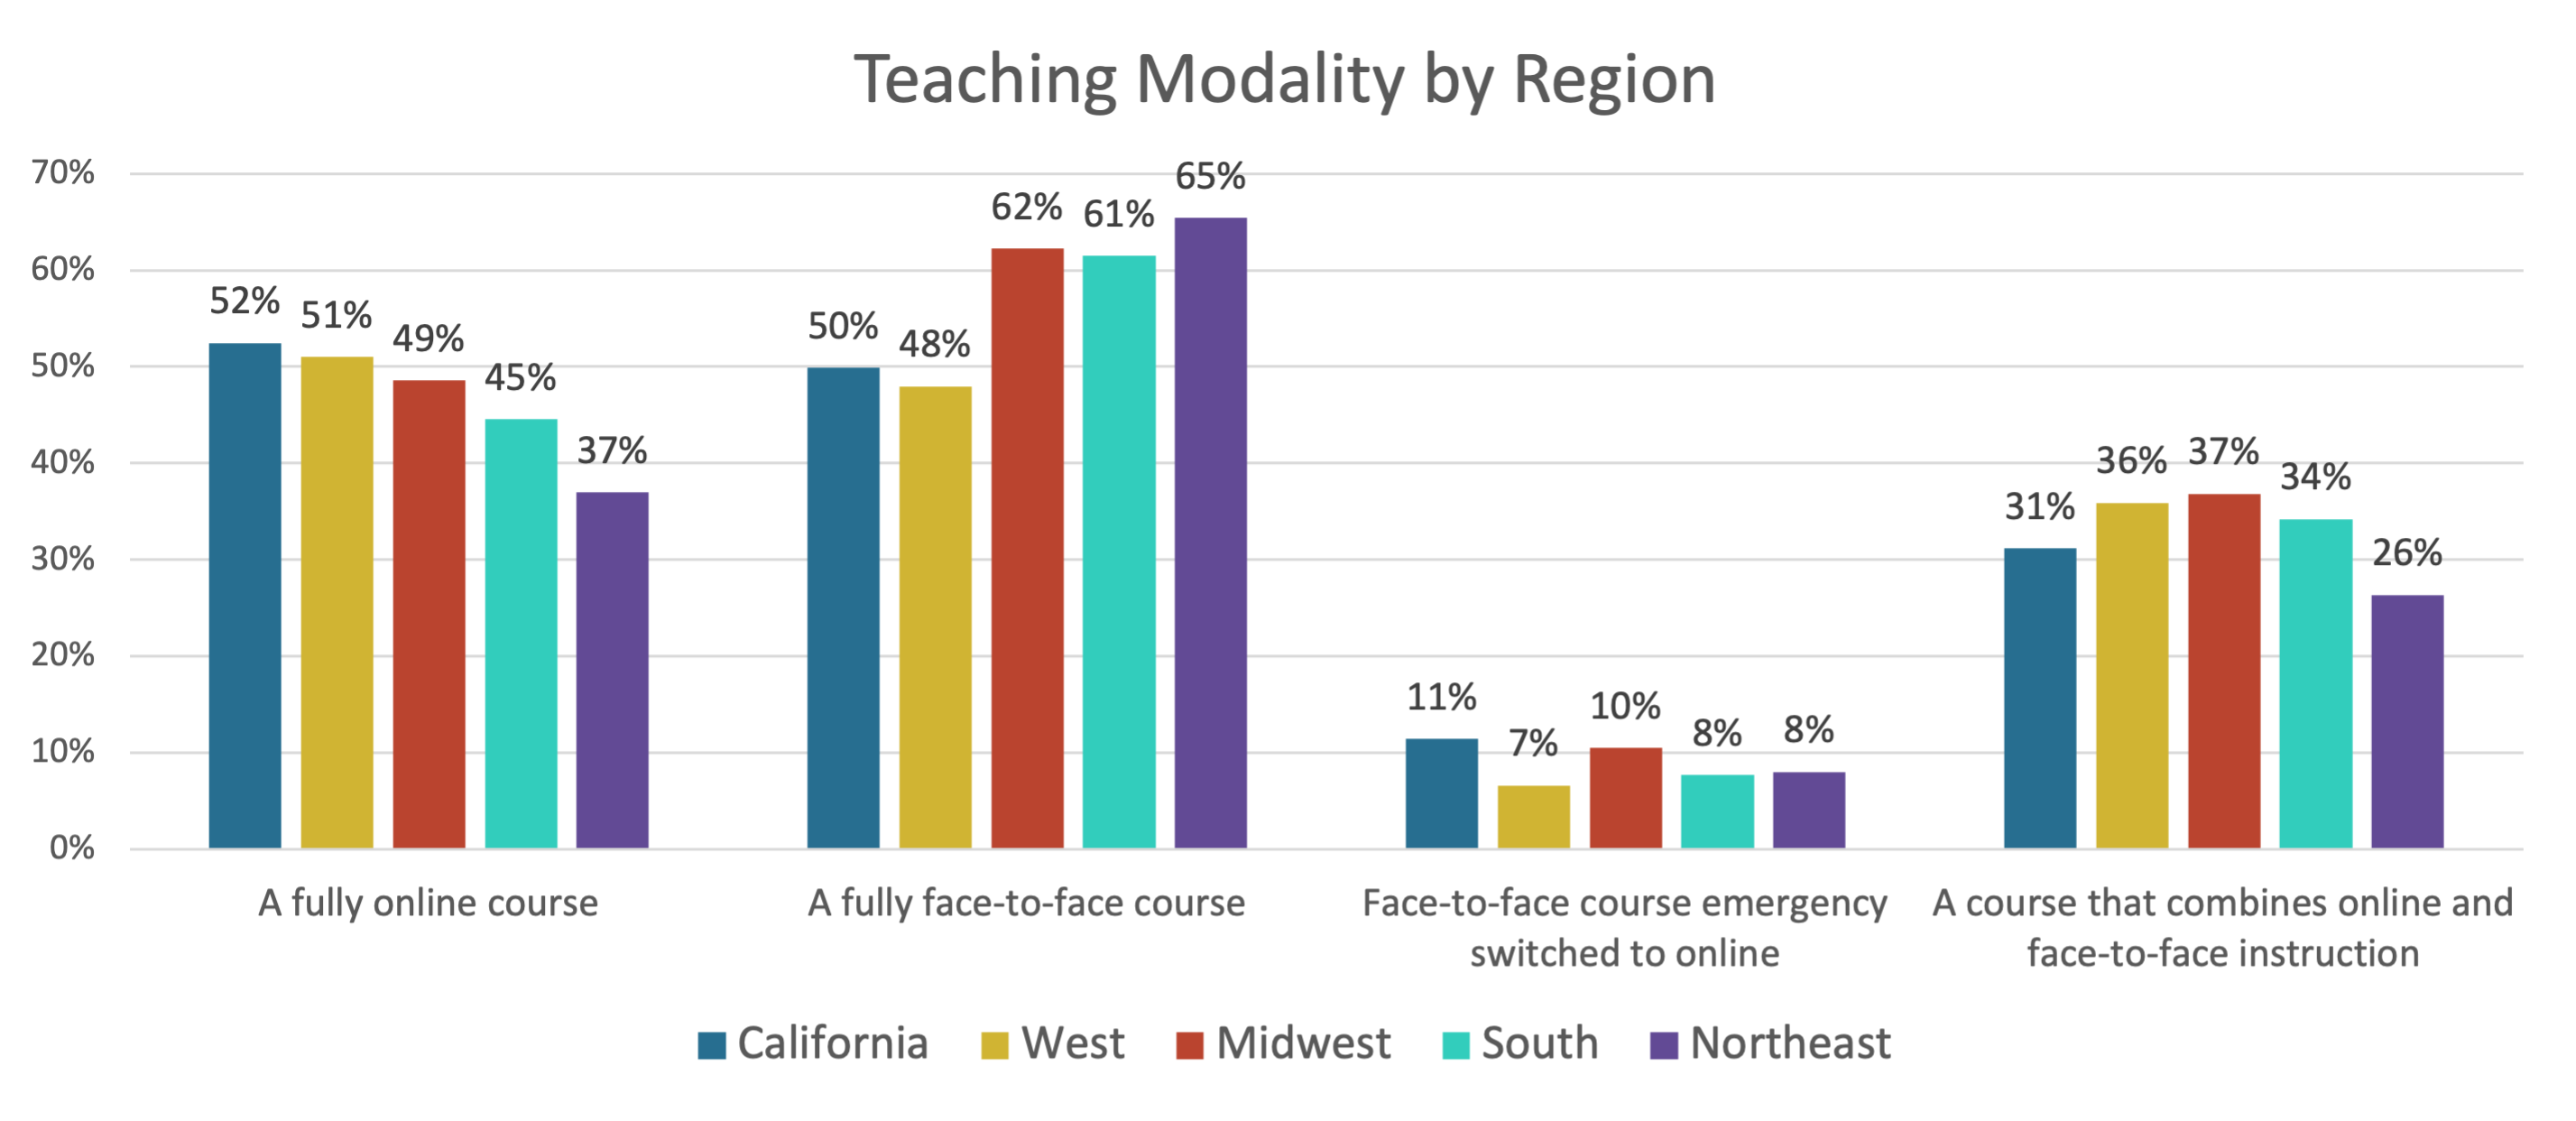
There was a return to face-to-face instruction in higher education institutions across the US in 2021-22, as compared to the pandemic-impacted 2020-21 school year. Overall, 58% of faculty stated they taught at least one course face-to-face in 2021-22, up from 14% in 2020-21. This is still far below the pre-pandemic, 2018-19 results, when 96% of faculty taught at least one course face-to-face. The return to face-to-face instruction was matched by a corresponding decrease in online-only courses, from 71% to 49%.— Intermediate Humanities Faculty
This pattern was in evidence across the country, though there were some regional differences. Faculty teaching in the western region of the US were less likely to teach a course face-to-face than those in the eastern region. California and the rest of the West were more likely to be fully online, too.
Several factors might help explain these differences. Western states generally had higher rates of online courses before the pandemic. Additionally, the rates may reflect differences in COVID measures in states. California, for example, had longer and stricter requirements than many other states that delayed return to face-to-face instruction at higher education institutions.
“The pandemic taught us that many classes or parts of classes can be taught digitally. Students are so tied to their phones and computers, that not using digital media is a disservice to them. Faculty is not changing rapidly enough to digital media to keep up with their students.”
Western US faculty show highest level of preference for digital classroom elements
This year’s survey found growing faculty acceptance for elements of online and digital classroom experiences, though rates varied by region. Our survey uses three measurements for digital acceptance: preference for teaching modality, preference for digital materials, and use of digital materials.— Intermediate Humanities Faculty
Teaching Preference
Over half of all faculty agreed that they want the option to teach some of their courses in a fully online format. Faculty in the Northeast were least likely to want this option, with only 44% agreeing; this was the only region were less than a majority of faculty agreed. Faculty in the California and the West region were most likely to agree, at 60% and 64%, respectively.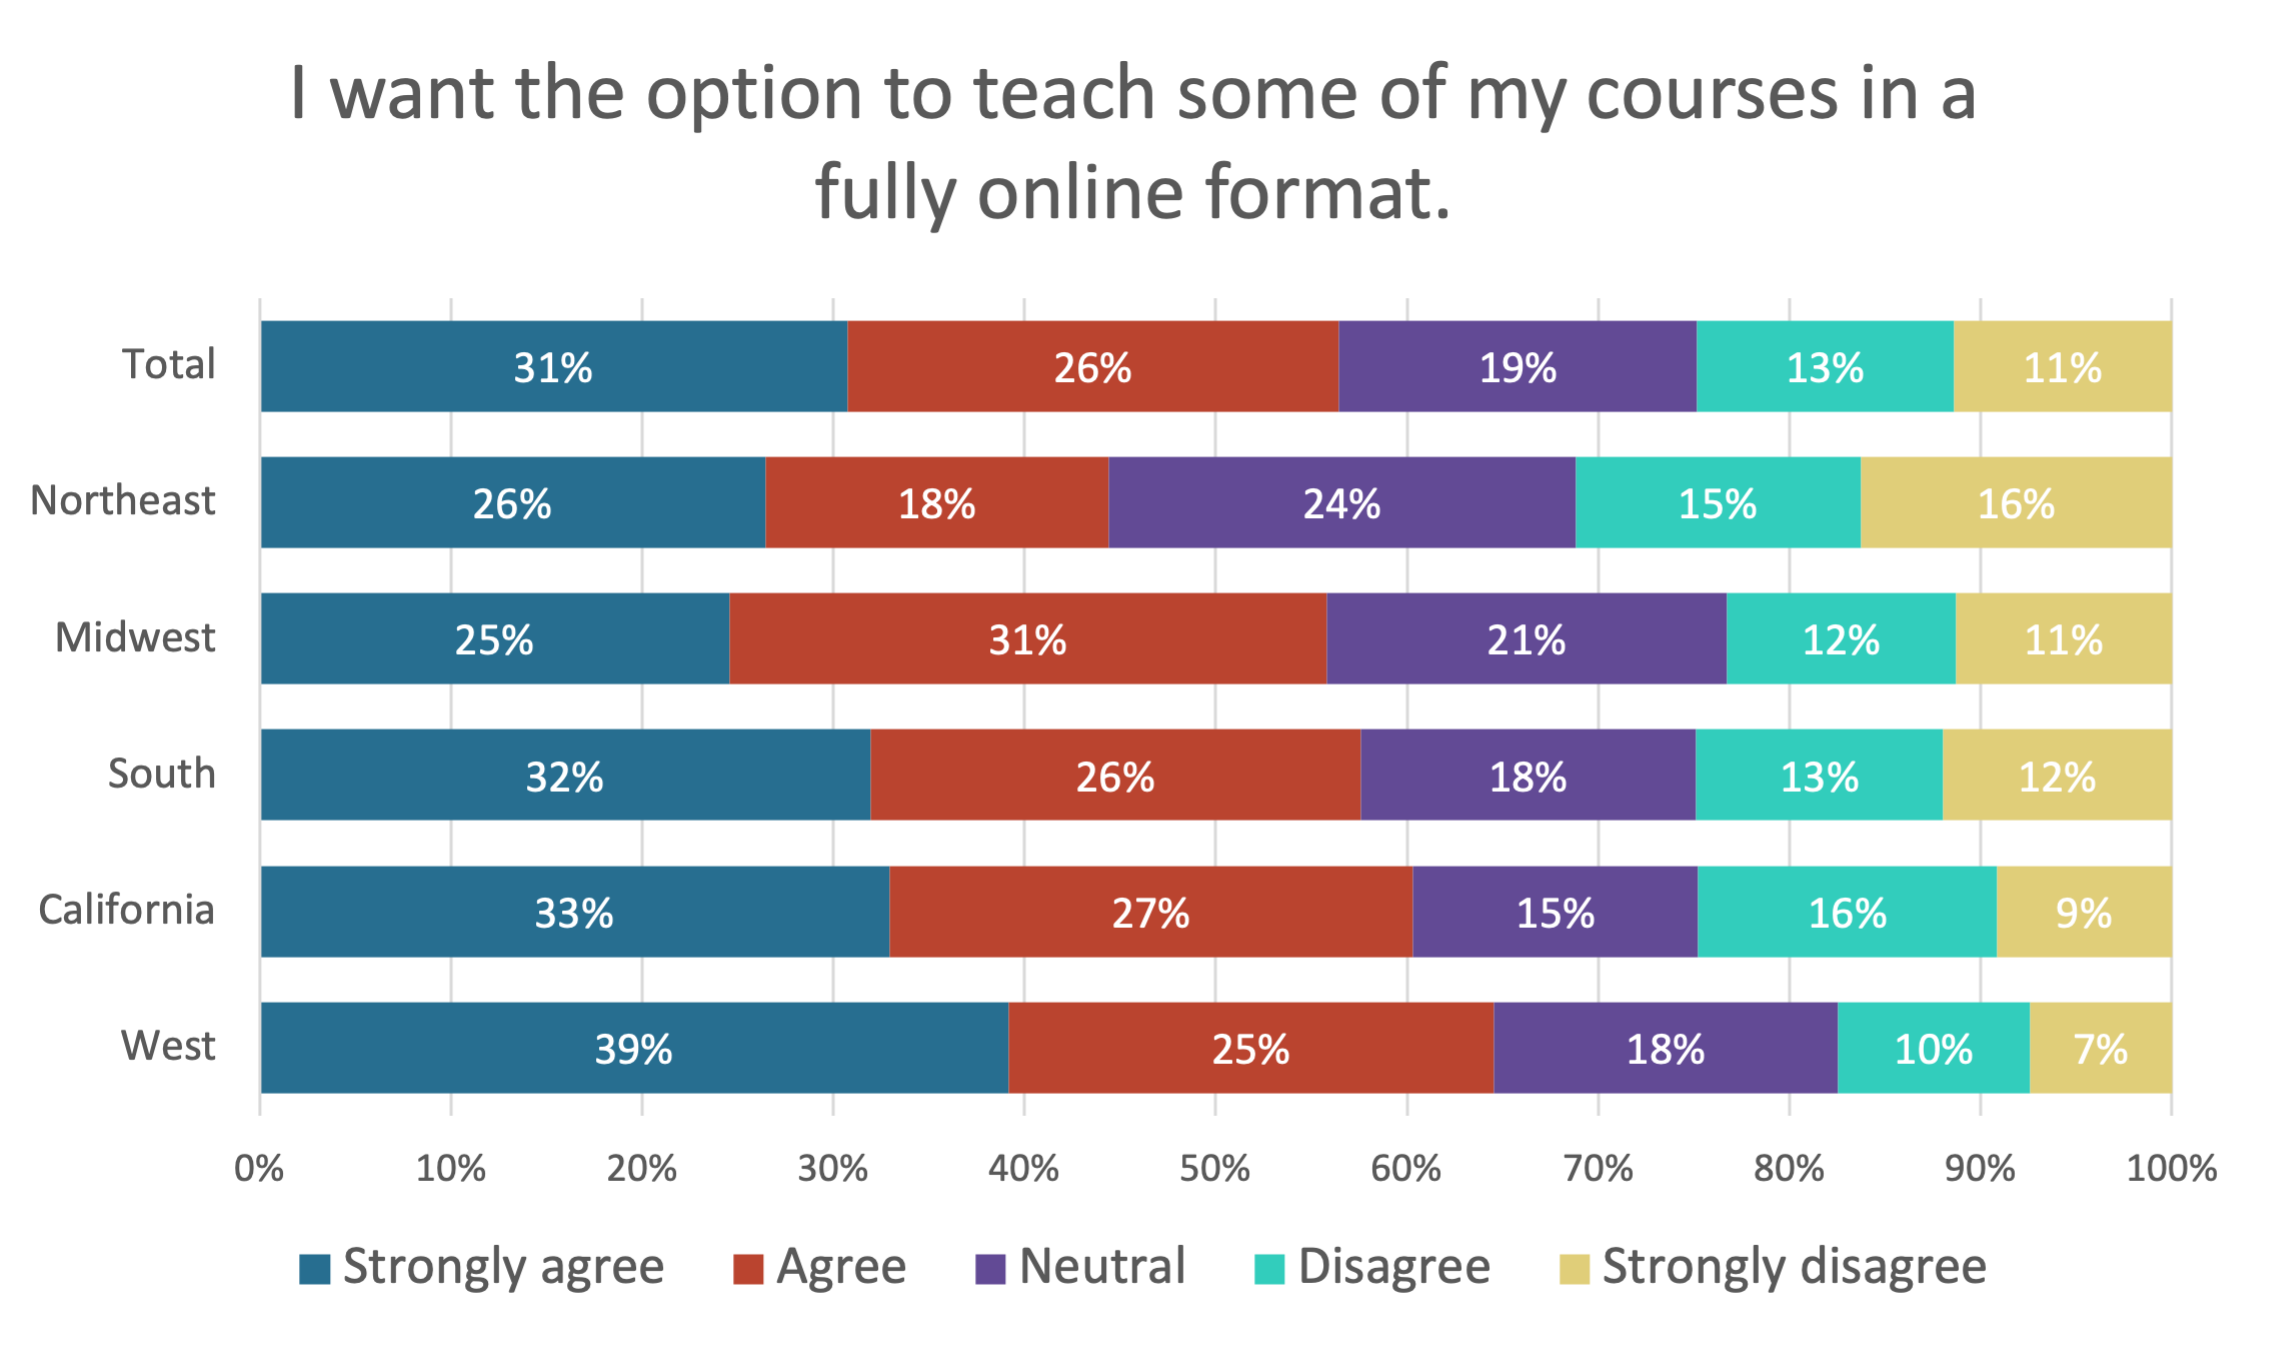
Preference for Digital Materials
Faculty were asked to rank their preference for classroom materials on a scale from 0, representing print, to 100, representing digital. The result was an average score of 55, indicating an almost equal preference for print and digital. While overall preferences were similar across the country, respondents in California and the West region expressed greater preference for digital than other regions.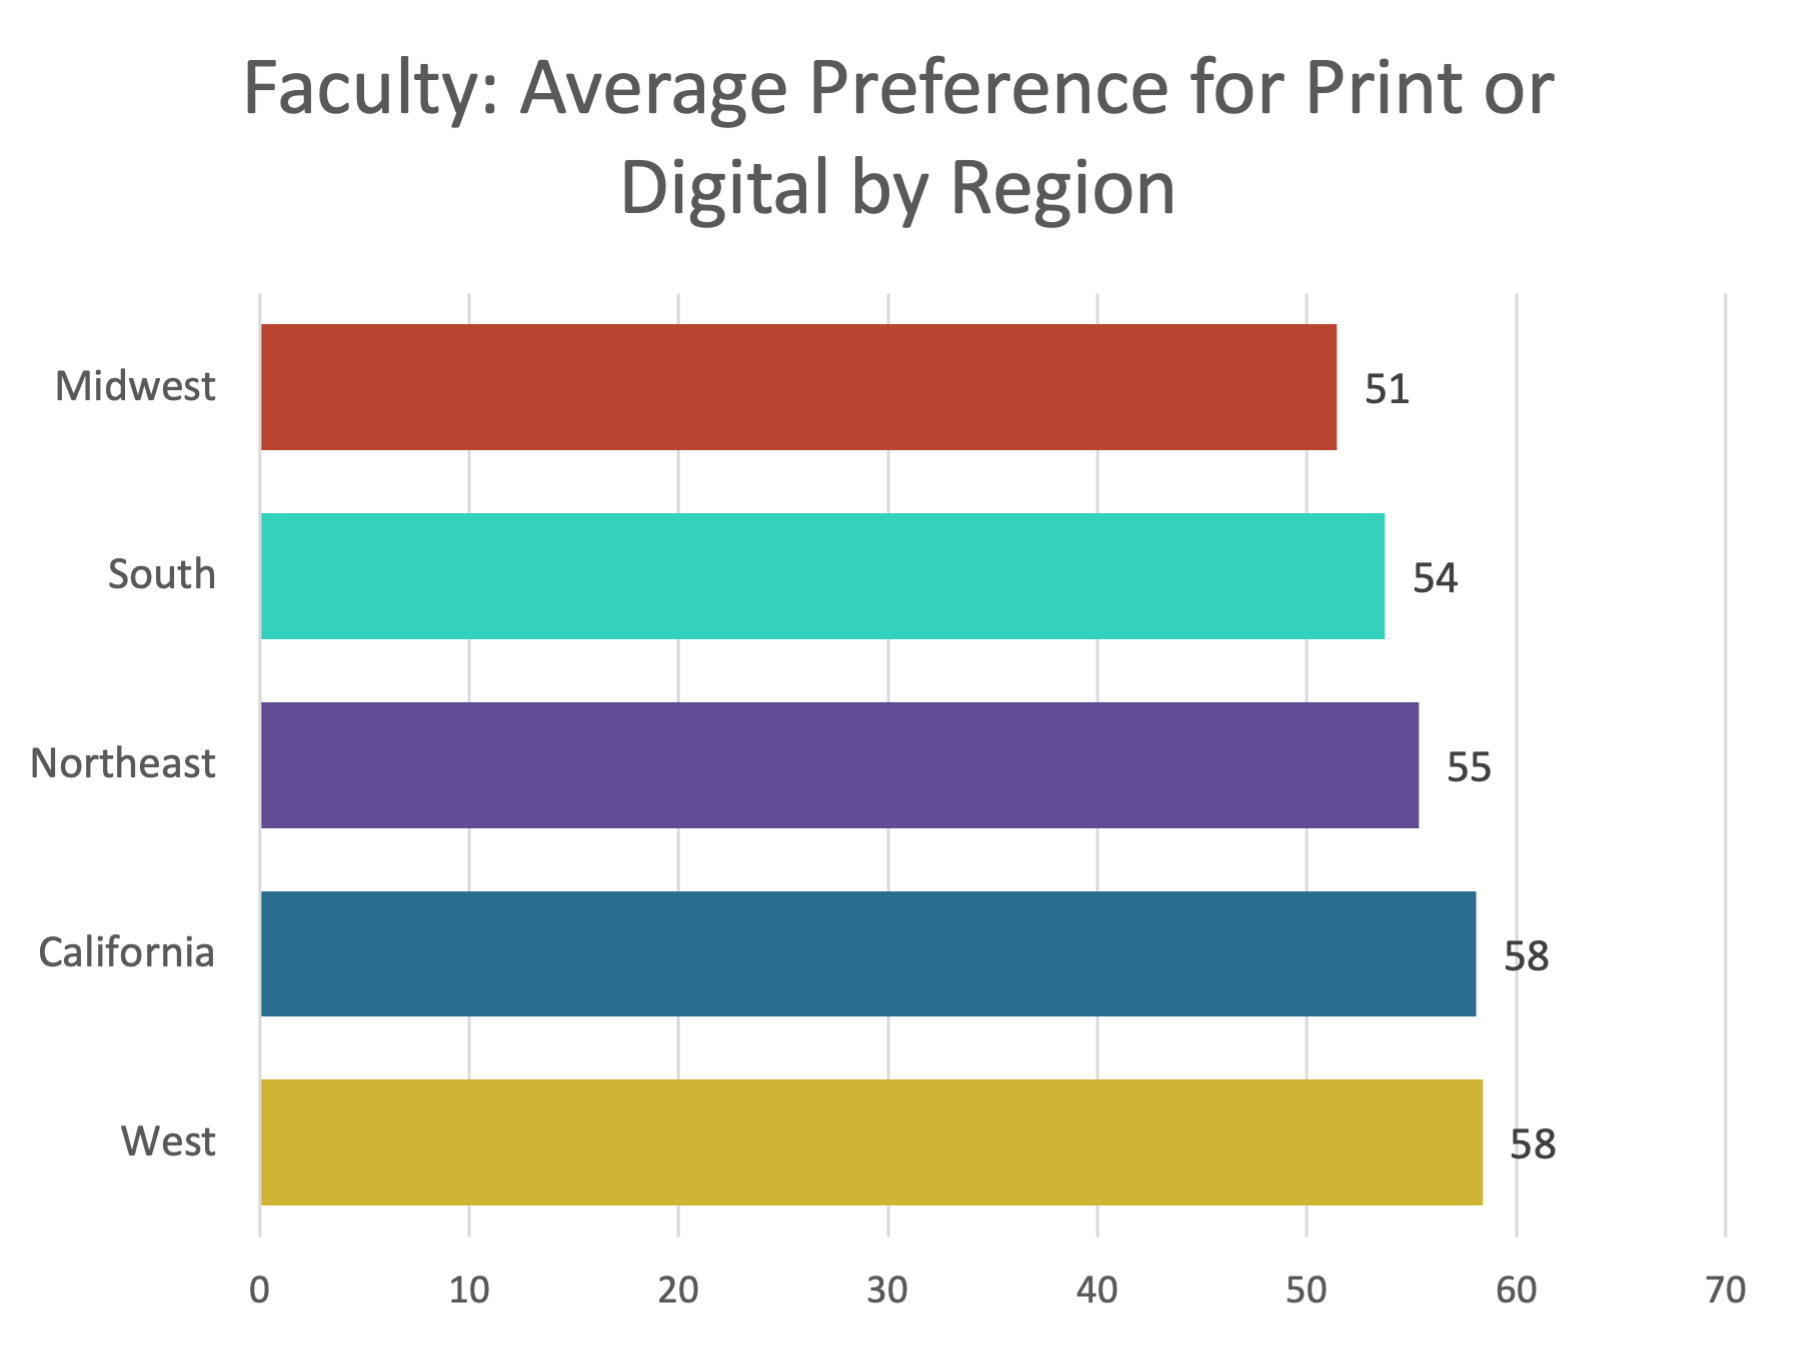
“As we are very rural and high poverty, access to the Internet at home is a real barrier for our students. Therefore, I never use a digital homework system, since students may not have access when they need it. Also, I won’t use a digital textbook with supplements that require always-on Internet access.”
— Advanced Arts & Literature Faculty
Use of digital materials
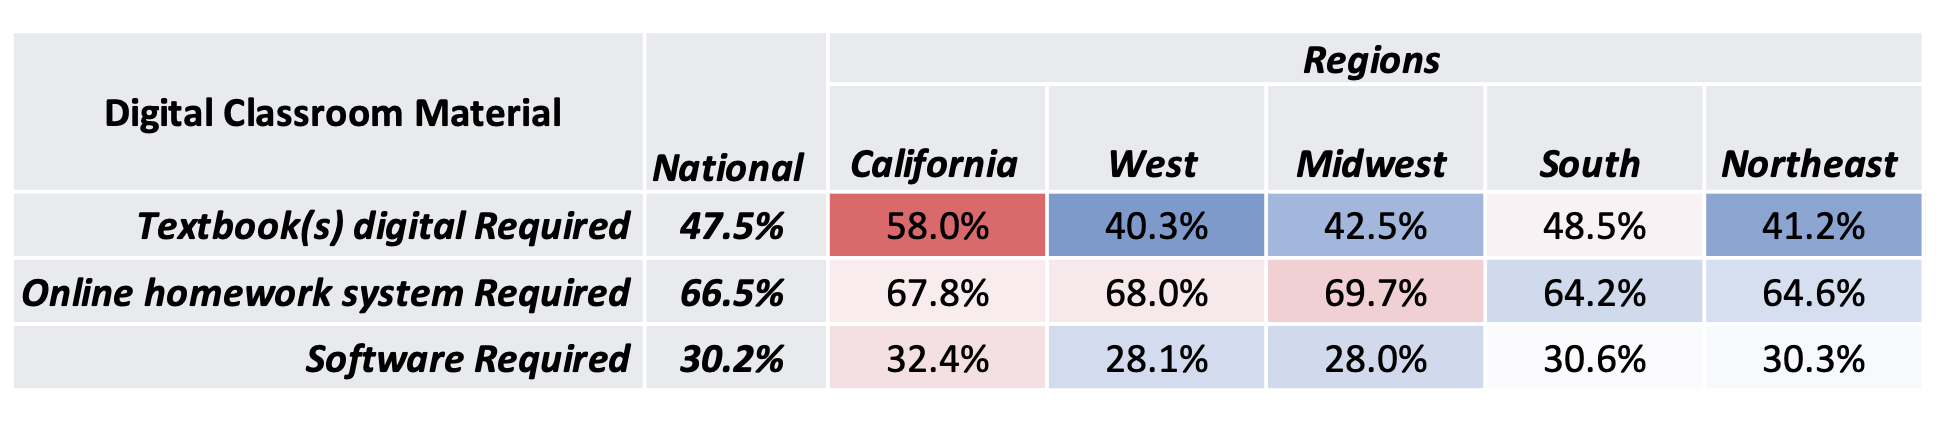
Faculty were asked to share the types of classroom material they used for their courses with the largest enrollment. Our results show many differences when comparing materials used by region, especially for digital tools.The largest difference between regions was the requirement of a digital textbook, from 58% in California, compared to 40-48% in all other regions. There is a smaller variance in the requirement of an online homework system, from 69.7% in the Midwest region compared to a low of 64.2% in the South. The use of required software sat at 34.2% in California and drifted as low as 28% in the Midwest region.
California leads the surveyed regions for use of digital materials, with the highest use of digital textbooks and software, and higher use of online homework. In fact, over half of California faculty said they require a digital textbook, 13% more than the number who require a print textbook.
Awareness of OER varies by region
“Having moved to open resources, I will never again use expensive textbooks. Using OER and an array of supplemental texts enables me to customize my art history courses in response to current events and discoveries, to keep the courses fresh and engaging, and - most importantly for my predominantly low-income students - to ensure that the source materials are free to them.”
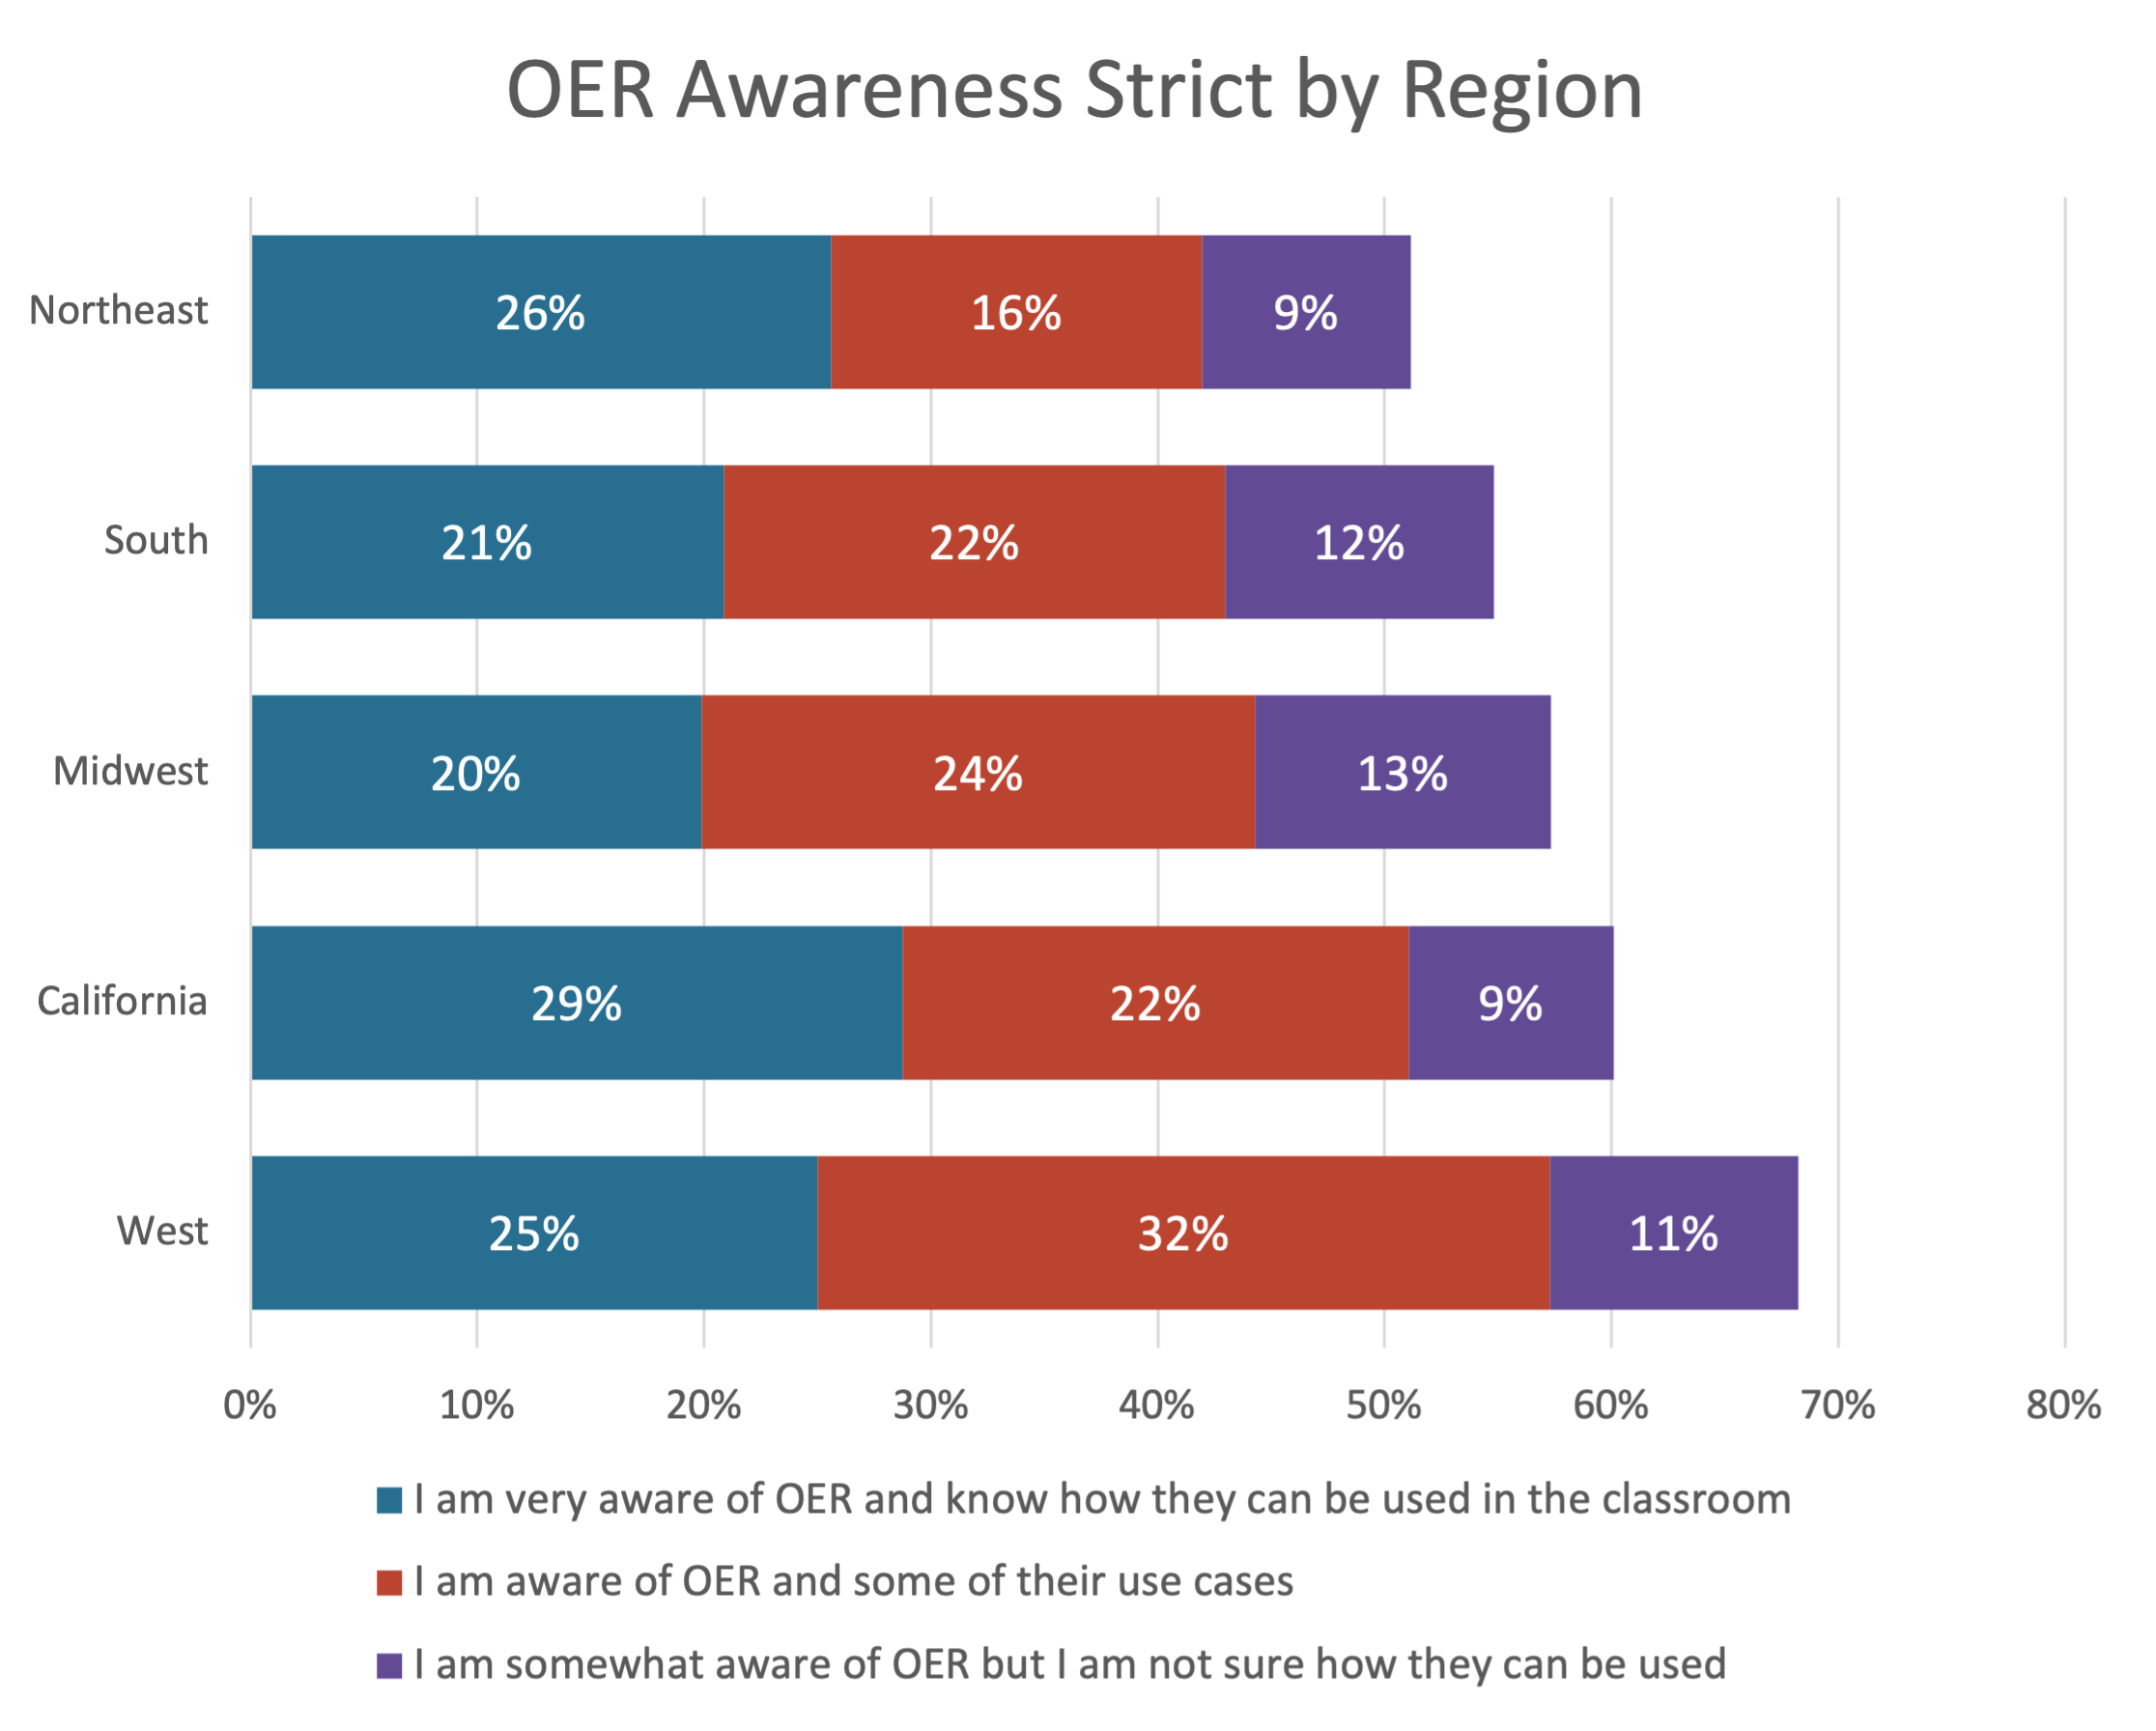
Open education resources (OER) are a popular example of digital course material. They are teaching, learning, and research resources that reside in the public domain, or have been released under an intellectual property license that permits their free use and re-purposing by others. Awareness of OER has been growing year over year, from 27% in 2014-15 to 57% in 2021-22. This is the first year that a majority of faculty reported some level of awareness.— Introductory Arts & Literature Faculty
A majority of faculty in all surveyed regions report being aware of OER. The lowest level of awareness was in the Northeast (51%), though that region also has the second highest rate of faculty who are “very aware” of OER. The highest rates of awareness are in the western US, with 60% in California and 68% in the West region.
Final thoughts
Online learning and digital tools and materials have seen increased acceptance and adoption in the US, spurred in part by online teaching experiences during the pandemic. But not all faculty agree, and opinions seem to fall along a geographic divide: acceptance of online learning is highest on the west coast, and lowest in the east.There are a few possible explanations for these discrepancies. Faculty preferences and material choices are influenced by their department and institutions, which might limit the number and quality of materials that are accessible. Furthermore, each region, state, and institution may have their own policies and campaigns to promote specific curriculum or classroom.
That being said, the gulf between proponents of digital materials and those who prefer print isn’t especially broad and is shrinking year after year. Our surveys have found a growing trend of acceptance and use of digital materials across the country. Print isn’t going away yet, but educators increasingly see the utility of digital materials and classroom experiences.
About this research brief
The data presented here comes from our 2021-22 national survey of higher education faculty and administrators. All reports use responses from nationally-representative samples. This project supported from grants from the William and Flora Hewlett Foundation. More information and the full reports and infographics are available here.Recent Publications
Digital Learning Pulse Surveys
- Infographic: 2023-2024 Digital Learning Pulse Survey
- The Digital Transformation of the Community College
- Planning for a Smaller Future: Dealing with Declining Enrollments
Course Material Affordability
- Pennsylvania Course Materials Survey 2023
- Pennsylvania Course Materials Presentation
- Course Material Webinar Slides
Open Educational Resources
- Digitally Established: Educational Resources in U.S. Higher Education, 2023
- Curricula of Many Sources: Educational Resources in U.S. K-12, 2023
- Research Brief: Digital and OER Textbook Adoption
- Research Brief: Faculty Satisfaction with Course Materials varies by Publisher
STEM
- Teaching Online: STEM Education in the Time of COVID
- What Makes a STEM Student
- Perceptions of the Future of STEM Education
Distance Education
- Digital Faculty: Faculty Social Media Use and Communications
- Infographic: Digital Faculty
- Grade Increase: Tracking Distance Education in the United States
Follow us on
Privacy
All survey respondents are provided complete anonymity. No personally identifiable information is released. Full privacy policy.